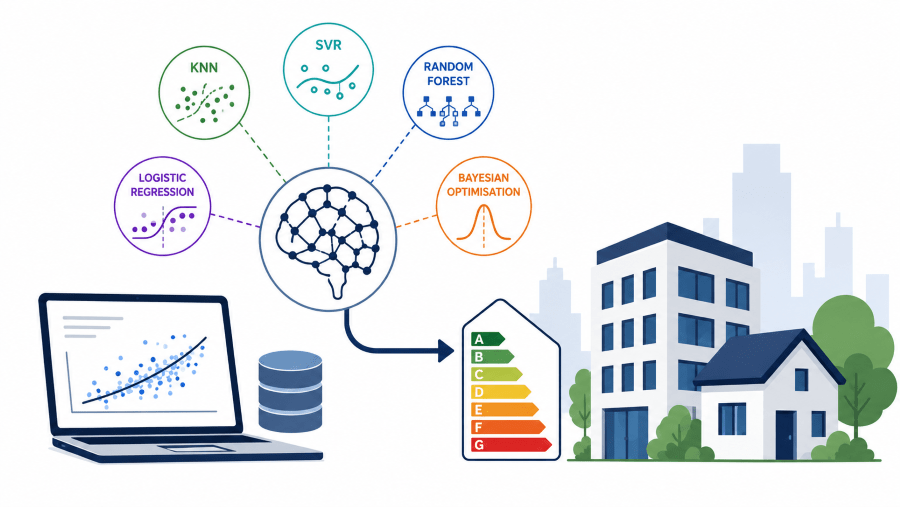
Over the past few weeks, I’ve been working through Imperial College London’s Professional Certificate in Machine Learning / AI. Comparing different machine learning models using the same dataset is a fundamental practice for learning the art of data science. So, I used it as an excuse to build something real: five notebooks predicting energy consumption from Sheffield’s EPC (Energy Performance Certificate) data. Each utilises a different method: Logistic Regression, KNN, SVR, Random Forest, and a custom Bayesian Optimisation pipeline.
My goal wasn’t just to find “the best model,” but to build skills I’d actually reuse. A few key lessons stood out.
GitHub: https://github.com/hellomayzune/Imperial-College-ML-Methods-Exercises
1. The Pipeline Matters More Than the Algorithm
Every notebook shares the same backbone: clean the data, define numerical and categorical features, impute missing values, scale, one-hot encode, split, and evaluate. Once that ColumnTransformer + Pipeline pattern is solid, swapping in a new estimator (KNN, SVR, Random Forest, HistGradientBoosting) becomes trivial. That repeatability is the true payoff, not any single model. It functions effortlessly whether the underlying estimator is linear, distance-based, or tree-based, and it remains leak-resistant by construction, a benefit that deserves more credit than it gets.
2. Problem Framing Is a Decision in Itself
The Logistic Regression notebook used the same dataset as the others, but asked a different question. By splitting energy_consumption_current at the median, a regression problem transforms into a classification task where accuracy jumps to 93%, and ROC AUC hits 0.98. While that looks great for a presentation, it strips away all nuance regarding how high or low consumption actually is. It’s easy to miss that trade-off between how much you know and how well you can measure it if you only look at the final metric.
3. Tuning Has a Learning Curve
Setting SVR’s C and epsilon by hand or tuning Random Forest’s max_depth yields a decent model. Building a small Bayesian Optimisation loop, utilising a Gaussian Process surrogate proposing hyperparameters and tested via cross-validated RMSE, pushed R2 from about 0.91 to 0.94 on a comparable task. It was worth doing, but the harder skill was judging when that extra compute is truly necessary versus when a simple grid search or manual choice suffices.
4. Diagnostics Catch What Accuracy Hides
Residual plots, Q-Q plots, and permutation importance routinely catch things raw scores hide. In the tree-based models, current_energy_efficiency dominated feature importance, accounting for over 68% in Random Forest. Rather than a headline result, that served as a warning sign for target leakage, and a sharp reminder to interrogate a model rather than blindly report its score.
5. Real-World Applications in the Built Environment
These lessons translate directly to the built environment. EPC data is a messy, large-scale dataset featuring millions of records, inconsistent categories, and missing values, with outcomes like energy use, retrofit priority, and compliance risk feeding straight into policy and investment decisions. Reusable pipelines mean retrofit-targeting or EPC-classification models can be updated as new data arrives instead of being rewritten from scratch. Furthermore, the leakage point isn’t merely academic: using EPC-derived efficiency ratings that correlate too closely with your target variable is the exact kind of oversight that could quietly undermine a retrofit-prioritisation programme.
6. The Research Angle
Consistency matters in research. Using identical preprocessing across models makes method comparisons meaningful rather than anecdotal. Documenting limitations alongside results is good practice, and treating hyperparameter search as an explicit, reproducible step, rather than an unreported manual choice, significantly strengthens a paper’s methods section.
None of these five notebooks represents a finished product. But building them made one thing clear: applied ML isn’t really about picking the right algorithm. It comes down to pipeline discipline, intentional problem framing, tuning judgment, and intellectual honesty about what your diagnostics are telling you. Those are the skills that transfer far beyond any single dataset.
Leave a Reply